
79% of Americans over the age of 65 report the value of their retirement savings has declined in recent years.In other words, they are losing money! What can you do to avoid falling into this financial trap?
Simple: you need a tool which delivers a snapshot of your current investment portfolio.A tool that displays in an easy and illustrated way where your assets are positioned and how much of them are at risk. You need the Financial Health Spectrograph.
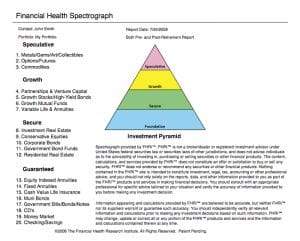
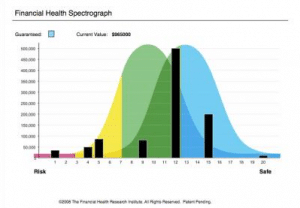
The Financial Health Spectrograph is an unbiased, color-coded graphical analysis of your assets that is based on the Investment Pyramid, the most widely accepted asset diversification model. Diversification basically means “don’t keep all of your eggs in one basket.” And the Financial Health Spectrograph shows you where all of your “eggs,” or assets are currently positioned. In other words, it plots your assets across a spectrum of risk, according to your age. Through the use of bell curves, the Financial Health Spectrograph can communicate the “ideal” investment areas for a particular age group. Based on this information you are able to ensure that your investments are diversified adequately for your situation, whether it be pre-retirement or post-retirement.
The Spectrograph is only a diagnostic tool used to understand the positioning of your assets in relation to risk and return. It works in concert with AssetTrack,the asset tracking application available via F&H’s secure website. To access the Financial Health Spectrograph and other great tools, SIGN UP today!