The Battle of Risk and Reward in Your Portfolio
Statistic often have the effect of dulling our sense of reality. When government and businesses toss out percentages and lump us into pre-determined demographic groups, it’s hard to internalize whatever message they’re trying to convey. We get lost in the coldness of the data. The impersonal nature of raw numbers. Unless, of course, the statistic is so startling, so verifiable, it makes you stop dead in your tracks and nod in bewildering agreement.
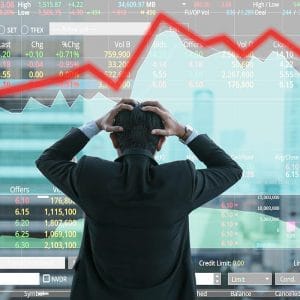
Case in point: 80% of Americans have lost half or more of their entire portfolio in the last three years. Are you nodding?
If you’re a part of that 80%, no doubt the reporting of this statistic is a painful reminder of your losses. While we’re often taught to learn from our mistakes, in the case of investing it’s difficult to know both where we went wrong and how to prevent it from ever happening again; after all, we’re not experts…And we’re not expected to be. So to find out the answers we likely turn to the people who are, namely, the money managers and stockbrokers who recommended these failed investment strategies. Of course, talking to the experts will likely yield several different reasons for a plummeting portfolio.
From 9-11 and war to the recent crop of corporate and mutual fund scandals, you’ll likely see fingers pointed in every possible direction. Yet, a closer look reveals these events might not have contributed as much to these losses as initially thought. In fact, this phenomenon may actually be the result of something much more insidious and less obvious.
But to get there, we first have to examine why those otherwise accepted scapegoats are merely excuses which hold little or no veracity.Did the terrorist attacks and the market downturn that followed cause the collapse in our portfolios? While this catastrophic event may have contributed to some of the losses experienced within the last three years, it certainly doesn’t account for all of them. For one, the statistic is based on the last three years-a year and a half before that fateful September day-not to mention the economy was already experiencing a recession when the terrorists struck. But maybe the most compelling evidence comes when you look at the numbers.
 By October 16th, a little over a month after the attack, the S&P 500 had already reached its September 10th level. Two years later, by September, 2003, the Nasdaq was up 10 percent from pre 9-11 totals. In addition, the Dow Jones closed at approximately 9,600 on September 10, 2001, and at the writing of this article, is well over 14,000.
Although we can all acknowledge 9-11 had some affect on our investment losses, we can also agree that it wasn’t the seminal event that led to 80% losing half or more of their portfolio.The next excuse represents the other big newsmaker and political talking point during the past few years: corporate fraud. But unless you were heavily invested in the companies involved in the bankruptcies and fraudulent accounting practices, such as Enron, Worldcom, and others, you likely saw very little affect on your portfolio.
And that brings us to the mutual fund scandal, which was exposed in late 2003. With more than 90 million Americans invested in mutual funds and a combined $7 trillion in assets, these products were once the darlings of the modern investor…But now?
“The mutual fund industry is the world’s largest skimming operation – a $7 trillion trough from which fund managers, brokers, and other insiders are steadily siphoning off an excessive slice of the nation’s household, college, and retirement savings,” explains Senator Peter Fitzgerald, chairman of the Senate Subcommittee on Financial Management.
The “beat up on mutual funds” bandwagon is in full swing…Even those professionals and popular investing websites who convinced you to invest in mutual funds are suddenly crying foul.Yet, long-term shareholder losses from the scandal measure approximately .06% in domestic equity funds, according to Eric Zitzewitz, Assistant Professor of Strategic Management at the Stanford Graduate School of Business. So as unethical and disturbing as these scandals may have been, they likely represent a mere drop in the bucket with regard to your overall earnings, particularly when compared to the substantial losses suffered by investors since the late 1990’s.
An Investment Gut Check
It’s no surprise that many Americans with retirement portfolios languishing at levels from a decade ago are wondering how they could have lost so much, so quickly.
Incidentally, 77% of the accumulated wealth in this country is held by people over age 55, so it’s no secret what group was left most devastated by the losses.
They were all likely scratching their heads in disbelief at this sudden, and significant drop off; after all, these investors had been assured by their brokers and planners that they were properly “diversified.”
Diversification teaches investors to avoid putting all of their eggs in one basket, and it’s intended to help protect investors from market fluctuations. But if investors were truly diversified, why did 80% lose at least half or more of their entire portfolio?
We’ve already established it wasn’t solely caused by the scandals currently breaking in the mutual fund industry, or 9-11, or the war, or corporate fraud…So what did happen? Risky investments, that’s what.
As John Bogle, the founder of Vanguard Funds, one of the most prominent mutual fund companies in the world, explains, “We exploited the idea of a tech-led ‘new economy,’ and created some 500 new, and risky, aggressive growth and sector funds.” But if these investments were as risky as Mr. Bogle notes, how could investors have been convinced they were properly diversified?
The proof may be in the pudding…Or rather the pie.
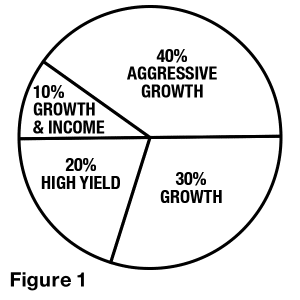
When purchasing mutual funds, many investors are shown an asset allocation model in the form of a pie chart. Asset allocation is the process of dividing a portfolio among major asset categories, like
- bonds
- stocks, or
- cash
While the fundamental purpose of the model is to reduce risk by diversifying the portfolio, it is mostly used to illustrate a person’s allocation in regard to mutual funds, only–funds that are comprised of non-guaranteed investments.
If you own mutual funds, you’ll likely find a pie chart right on your brokerage statement. The pie chart advises investors to spread their assets throughout the slices of the pie to diversify a portfolio and shield against substantial losses (Figure 1 illustrates a typical Wall Street asset allocation model). It is, in effect, designed to sell mutual funds. Whether you agree with the strategy or not, it seems to have worked quite well.
The Securities Industry Association reports that 75% of U.S. financial assets are invested in securities-related products (stocks, mutual funds, bonds, etc.) and 49.5% of U.S. households are invested in either individual stocks or stock mutual funds.The gung-ho attitude that led to increased investment in riskier vehicles was based on three fundamental principles:
- Returns
- Returns
- Returns
The prospect of higher returns was the fuel that drove us to risk larger percentages of our portfolios, especially with the knowledge that the pie chart would protect us. But was it worth it? During the past 20 years, the U.S. stock market has earned a return of 13% per year, while the average “pie chart” mutual fund investor has only earned a return of approximately 2% per year!
Risk and Reality
Regardless of the actual returns earned, if any of the investors who were flirting with high-risk investments had stopped to take a look at their true risk diversification they might have recognized the potential danger lurking behind their pie chart. Keep in mind, from a strict school of investing, the pie chart found on a brokerage statement is intended for asset allocation, only, and is rarely used to represent the risk diversification within your entire portfolio.
Risk diversification is an overall investment strategy that mixes a wide variety of investments in your financial plan to minimize the impact of any one investment on overall portfolio performance.This is an important point, since many investors tend to believe they are properly diversified merely because they are invested in various types of mutual funds, but this couldn’t be farther from the truth.
Sure you can be diversified within mutual funds, but that alone does not represent true risk diversification. It would be like having a barrel of oranges and claiming you have a lot of fruit. Sure you have lots of fruit, but only one type. What about produce of the non-citrus variety?
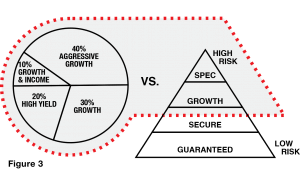
 If you’re wondering if there’s any model that can help you determine your true risk diversification, the good news is there is…the oldest, most widely-accepted risk diversification model: the Investment Pyramid.
Unfortunately, too many investors have never been introduced to this fundamental concept. Figure 2 illustrates the Investment Pyramid, a pyramid that is built according to the level of risk. Safe, or guaranteed, investments comprise the foundation and as you move up the Pyramid the riskier the investments become-moving from guaranteed to secure to growth, all the way to speculative at the very top. Each investment type is categorized in the pyramid according to its level of risk.
For example, a checking account would be found in the foundation, while arts and collectibles are located in the Pyramid’s tip. This model is one of the first concepts taught to aspiring financial planners and brokers. It is, after all, based on the most stable geometric structure–think about the pyramids of Egypt. But why is it so important to investing? Examine the Pyramid, closely, and you’ll notice there is a ratio between the area allocated for guaranteed investments to the area reserved for secure, growth, and speculative investments. This relates to the percentage of a portfolio that an investor would earmark for certain types of investments.
In other words, you wouldn’t want your portfolio to have a higher percentage of speculative investments than guaranteed investments, right? Doing that would skew the Pyramid by enlarging the top and minimizing the bottom until the structure becomes dangerously unstable.
Pie vs. Pyramid
So if the Investment Pyramid represents true risk diversification, what does the pie chart diversify? Plot a mutual fund pie chart out on an Investment Pyramid and you’ll find it doesn’t represent the entire Pyramid, but rather just a small portion of risky investments (see Figure 3). It focuses on the secure and growth sections of the Pyramid, without taking into consideration a solid foundation.
That being said, it should come as no surprise that at its market peak, the mutual fund industry took in $555 billion in new money invested in speculative, high-performance funds.
As Bogle reveals, “during the great bull market, mutual fund firms have prospered in an era of salesmanship, organizing, offering, and promoting risky funds at the best time for distributors to sell them and the worst time for investors to buy them.”
And the pie chart was their key selling tool.
If the investors who relied solely on a mutual fund pie chart to diversify had plotted their assets within the Investment Pyramid they would have found something that resembles Figure 4. Not exactly the very definition of stability. This method of investing actually negates all of the structural properties that make pyramids a good basis for a risk diversification model. In reality, the pie chart is more akin to profit diversification, since it diversifies the potential return, not the actual risk.

It should also be noted that brokerage firms offer numerous types of pie charts, but determining which one is right for you is not an easy task (keep in mind, there’s only one Investment Pyramid). Unless you’ve plotted your assets out on the Investment Pyramid you can never be sure that the pie chart you’re using is properly diversifying you in relation to your age and investment goals.
Sadly, the statistics suggest that many brokers and financial planners relied on a risk-heavy pie as a client’s sole risk diversification model. And using a pie chart model without comparing it to the Investment Pyramid and the distribution of all of your assets is like driving in a fog with zero visibility…
Financial Future Shock
In all fairness, it’s not a question of whether or not you should invest in mutual funds, equities, and securities…It’s a question of quantity. How much of your portfolio should you put at risk?
If 80% of Americans lost half or more of their entire portfolio, it would seem clear that too many of us risked too much. Of course, we thought we were diversified. And diversification was supposed to protect us. But that’s all just spilt milk now.
The true test will come in the actions we take in the future. As we move ahead, we’ll likely be more sensitive to the level of risk in our portfolios and we may even want to consider some of those cold statistics. This isn’t meant to disparage the pie chart, when used in relation to solid financial planning it could be helpful, but it should always be compared to an Investment Pyramid to ensure it reflects your particular needs.The Financial & Health Research Institute has created a revolutionary tool to help you determine the level of risk in your portfolio using the Investment Pyramid (Check out page 20 to read “Diversifying with the Investment Pyramid: F&H’s Foolproof Way to Understand Risk”). Regardless of your investment strategy, educating yourself about financial planning advice is a safe bet no matter what the investment’s risk. And now that you’re armed with the Investment Pyramid, you’ll know whether that pie you’re presented with is in fact just half-baked.